Presenting results and findings
The results section of a research paper is where you present the data collected and the findings derived from your analysis. This lesson will guide you in organizing your results clearly, utilizing tables and figures effectively, and interpreting your findings objectively. By the end of this lesson, you will be able to write a well-structured results section.
Lesson objectives
At the end of the lesson, you should be able to:
- organize and present research findings clearly;
- utilize tables, graphs, and charts to display data effectively;
- interpret research results objectively; and
- write a results section that accurately communicates the findings.
This refers to the organization of data that are usually presented in charts, tables, or figures with textual interpretation.
- Data gathered are in paragraph form or narrative form, describing the characteristics of population based on the data collected and organized by giving highlights.
- Data are written and read.
- It is a combination of texts and numbers.
- It is applicable only when presenting new information.
“Of the 150 sample interviewed, the following complaints are noted: 27 for lack of books in the library, 25 for a dirty playground, 20 for lack of laboratory equipment, 17 for not maintained school buildings.”
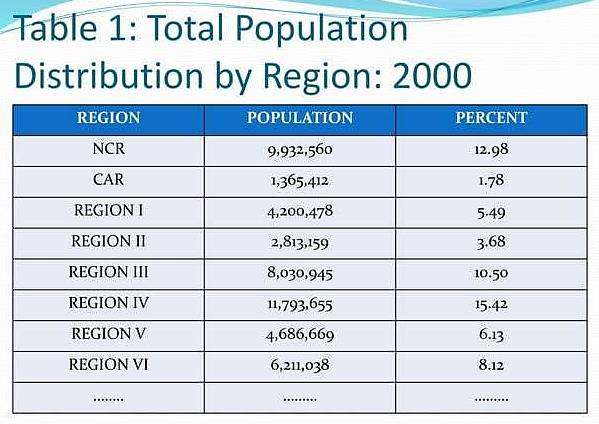
- It provides exact values and illustrates results efficiently as they enable the researcher to present large amount of data in a small amount of space.
- Data are organized into classes or categories by rows/ and or columns and appropriate pieces of information are found in the cells of the table.
- Some details are lost when data are summarized
- Elements of table: title, rows, columns, label, and data
Sample of Tabular Data Presentation
Source: https://www.slideshare.net/slideshow/presentation-of-data-37973327/37973327
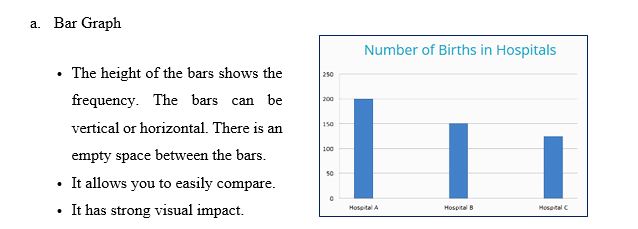
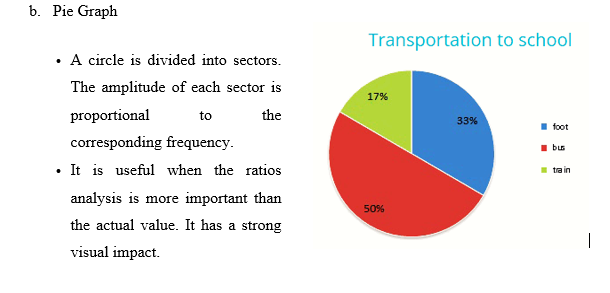
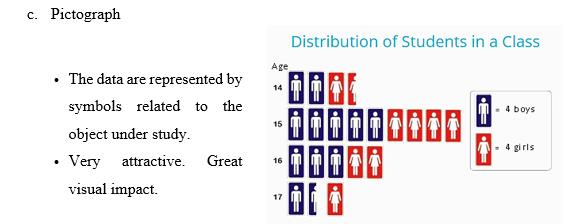
- It is a visual display of data by using symbols such as bars, lines, slices or pictures.
- It shows relations, comparisons, and distributions in a set of data like absolute values, percentages, or index numbers.
Different Graphs Used in Presenting Data
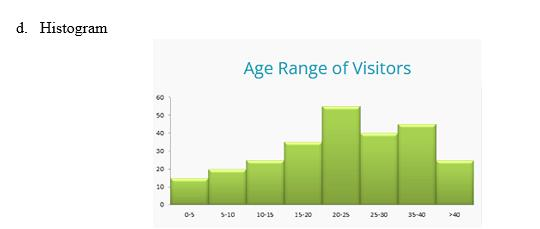
It is a bar graph in which the height of these bars is proportional to the frequency. There is no space between bars. It is only used if the variable is quantitative and the scale of the values is continuous. For certain situations, it is the only correct way to present the data. The histogram gives an idea of how the data is distributed.
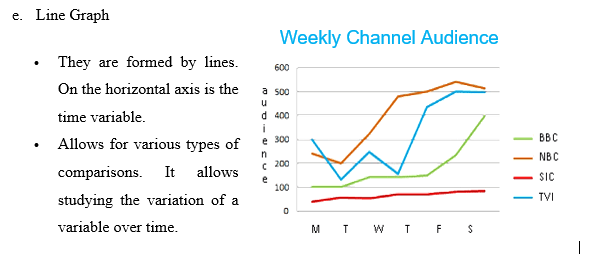
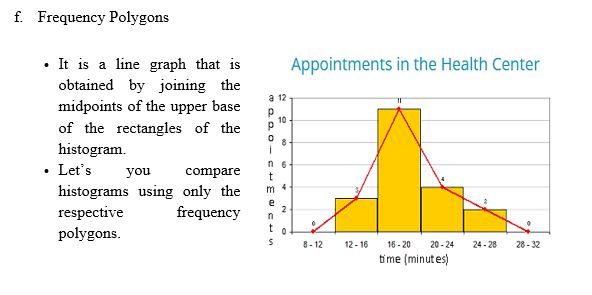
Analysis: Describing data with tables, graphs, or narrative; transforming data into information
Interpretation: Adding meaning to information by making connections and comparisons and by exploring causes and consequences.
- It refers to the implementation of processes through which data is reviewed to arrive at an informed conclusion.
- Intelligence and logic of the researcher is required in this part.
- The analysis and interpretation will be the bases of the findings of the study.
- Does the indicator meet the target?
- What is the programmatic relevance of the finding?
- What are the potential reasons for the finding?
- How does it compare? (Trends, group, differences)
- What other data should be viewed to understand the finding (triangulation)?
- Conduct further analysis.
- Organize data into logical, sequential, and meaningful categories and classifications to make them amenable to the study and interpretation.
- Explain the data or facts in terms of quantity, quality, attributes, traits, patterns, trends, relationships among others so as to answer research questions/ problems or hypotheses, which involve statistical techniques and procedures.
- Give the possible meaning, probable causes and effects of a situation or a condition as revealed by the findings.
- Suggest to continue the situation if the outcome is good and if otherwise, some remedies or measures should be done to eradicate or minimize its bad effects.
- Mention those who will benefit or will suffer from the study.
- It appears therefore that the…
- It was noteworthy that…
- It should be noted from the responses that…
- It should be mentioned that…
- It is expected that…
- Undoubtedly, many of the respondents claim that…
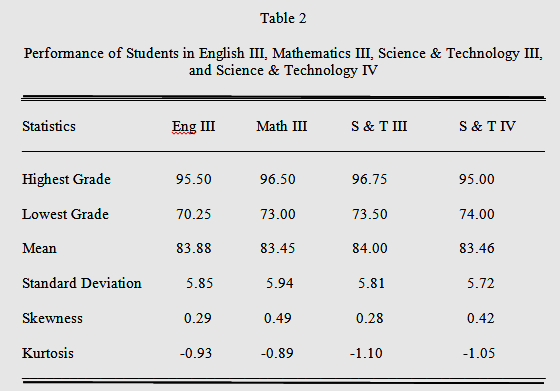
Source: Determinants of Performance of Students in Science and Technology IV by Junio, J. (2006).
Analysis and Interpretation of Data
The data revealed that there is a slight difference in the mean grades in English III, Math III, Science & Technology III, and Science & Technology IV.
This implies that the students’ performance in the 5 subject areas are comparable. The standard deviation indicates that most of the students grades in the 5 subject areas are clustered around the mean grades.
*Significant at the .05 level
Source: PUNP IGS towards Sustainability of Academic Excellence by Junio, J. (2011).
Analysis and Interpretation of Data
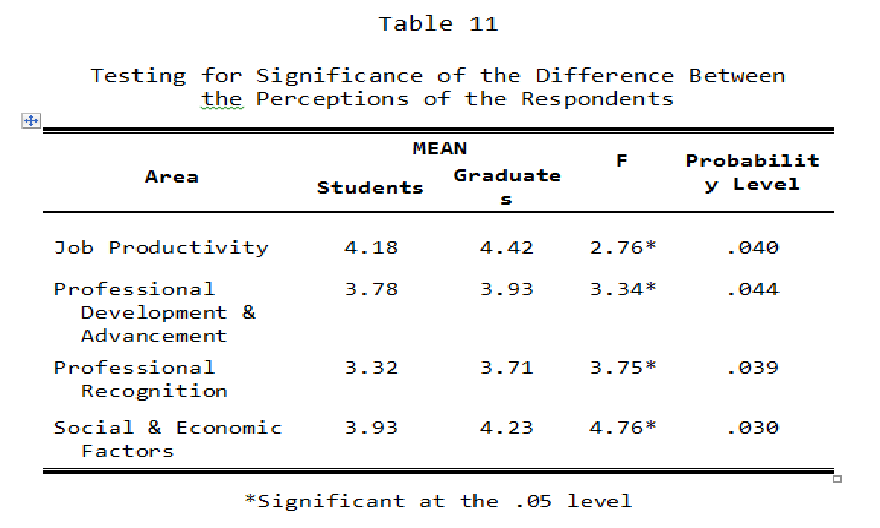
Table 11 shows the information about the testing for significance of difference between the perceptions of the respondents.
The table presents that the probability levels are lower than the .05 level of significance. This reflects that the two groups of respondents differ significantly on their perceptions as to the effect of their graduate studies.
Therefore, the null hypothesis which states that there is no significant difference on the perception of the respondents as to the effect of their graduate studies in terms of job productivity, professional development and advancement, professional recognition, and social and economic factors is rejected.
The finding denotes that the effect of graduate studies towards the graduates’ job productivity was greater than the students. This could mean that the graduates were more developed and advanced in their career than the students.
This could be attributed to the fact that finishing their graduate education contributed to their professional capabilities. Moreover, they have been promoted as a result of their graduate studies which means they have higher compensation.
Other possible reasons on the effect of the graduate studies are: the graduates received more certificates of commendation with regard to their job; and the graduates were more recognized in their community because of their scholarly contributions than the students.