Data analysis
Data analysis is a vital step in research that involves examining, organizing, and interpreting data to draw meaningful conclusions. It bridges the gap between raw data and actionable insights, enabling researchers to answer their research questions effectively. By applying appropriate methods and tools, data analysis ensures that the study produces reliable and credible results.
Lesson objectives
At the end of the lesson, you should be able to:
- define data analysis and its role in the research process; and
- differentiate between qualitative and quantitative data analysis techniques.
Data Analysis is the process of systematically applying statistical and/or logical techniques to describe and illustrate, condense and recap, and evaluate data. According to Shamoo and Resnik (2003) various analytic procedures “provide a way of drawing inductive inferences from data and distinguishing the signal (the phenomenon of interest) from the noise (statistical fluctuations) present in the data”.
Quantitative data analysis simply means analyzing data that is numbers-based or data that can be easily “converted” into numbers without losing meaning. For example, category-based variables like gender, ethnicity, or native language could all be “converted” into numbers without losing meaning – for example, English could equal 1, French 2, etc.
Quantitative analysis is generally used for three purposes:
- Measuring differences between groups – For example, the popularity of different clothing colors or brands.
- Assessing relationships between variables – For example, the relationship between weather temperature and voter turnout.
- Testing hypotheses in a scientifically rigorous way – For example, a hypothesis about the impact of a certain vaccine.
Quantitative analysis is powered by statistical analysis methods. There are two main branches of statistical methods: descriptive statistics and inferential statistics.
- Descriptive Statistics focus on describing the sample.
- Inferential Statistics aim to make predictions about the population based on the sample findings.
1. Descriptive Statistics
Used for describing a set of data, including:
- Frequency counts: The number of times an event or observation occurs.
- Percentage: A part of a whole expressed in hundredths.
- Measures of Central Tendency:
- Mean: The mathematical average.
- Median: The midpoint in an ordered range of numbers.
- Mode: The most frequently occurring number.
- Measures of Variability:
- Range: The difference between the largest and smallest values.
- Standard deviation: Indicates how dispersed a range of numbers is from the mean.
- Low standard deviation = numbers close to the mean.
- High standard deviation = numbers widely scattered.
- Variance: The squared value of the standard deviation.
- Skewness: Indicates the symmetry of a range of numbers, showing whether they cluster into a bell curve or skew to the left or right.
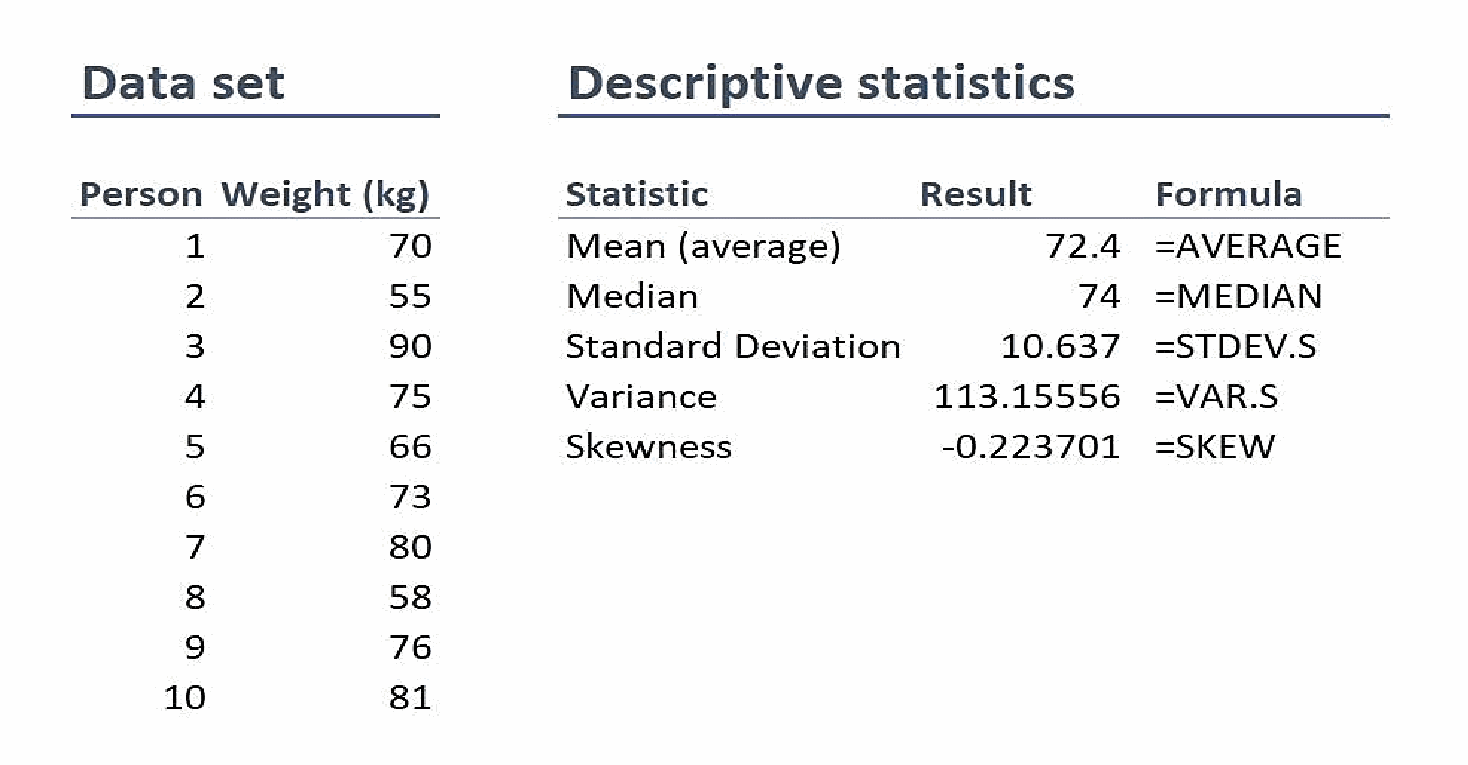
Source: Smith, J. (2024, November 19). Quantitative data analysis methods. Grad Coach. Retrieved from https://gradcoach.com/quantitative-data-analysis-methods/
On the left-hand side is the data set. This details the bodyweight of a sample of 10 people. On the right-hand side, we have the descriptive statistics. Let’s take a look at each of them.
First, we can see that the mean weight is 72.4 kilograms. In other words, the average weight across the sample is 72.4 kilograms. Straightforward.
Next, we can see that the median is very similar to the mean (the average). This suggests that this data set has a reasonably symmetrical distribution (in other words, a relatively smooth, centred distribution of weights, clustered towards the centre).
In terms of the mode, there is no mode in this data set. This is because each number is present only once and so there cannot be a “most common number”. If there were two people who were both 65 kilograms, for example, then the mode would be 65.
Next up is the standard deviation. 10.6 indicates that there’s quite a wide spread of numbers.
We can see this quite easily by looking at the numbers themselves, which range from 55 to 90, which is quite a stretch from the mean of 72.4.
And lastly, the skewness of -0.2 tells us that the data is very slightly negatively skewed. This makes sense since the mean and the median are slightly different.
2. Inferential Statistics
Used to analyze data from a sample and make inferences about the larger population, often for hypothesis testing.
A procedure for making rational decisions about observed facts.
- Null hypothesis: Suggests no effect or difference.
- Alternative hypothesis: Indicates an effect or difference exists.
Step 1. State the null and alternative hypotheses.
Step 2. Indicate the level of significance and type of test.
- For social science/behavioural research, 0.05 level of significance should be considered.
- For physical/mathematical science research, 0.05 level of significance should be considered.
- 0.05 is the commonly used significance level in accepting or rejecting the null hypothesis.
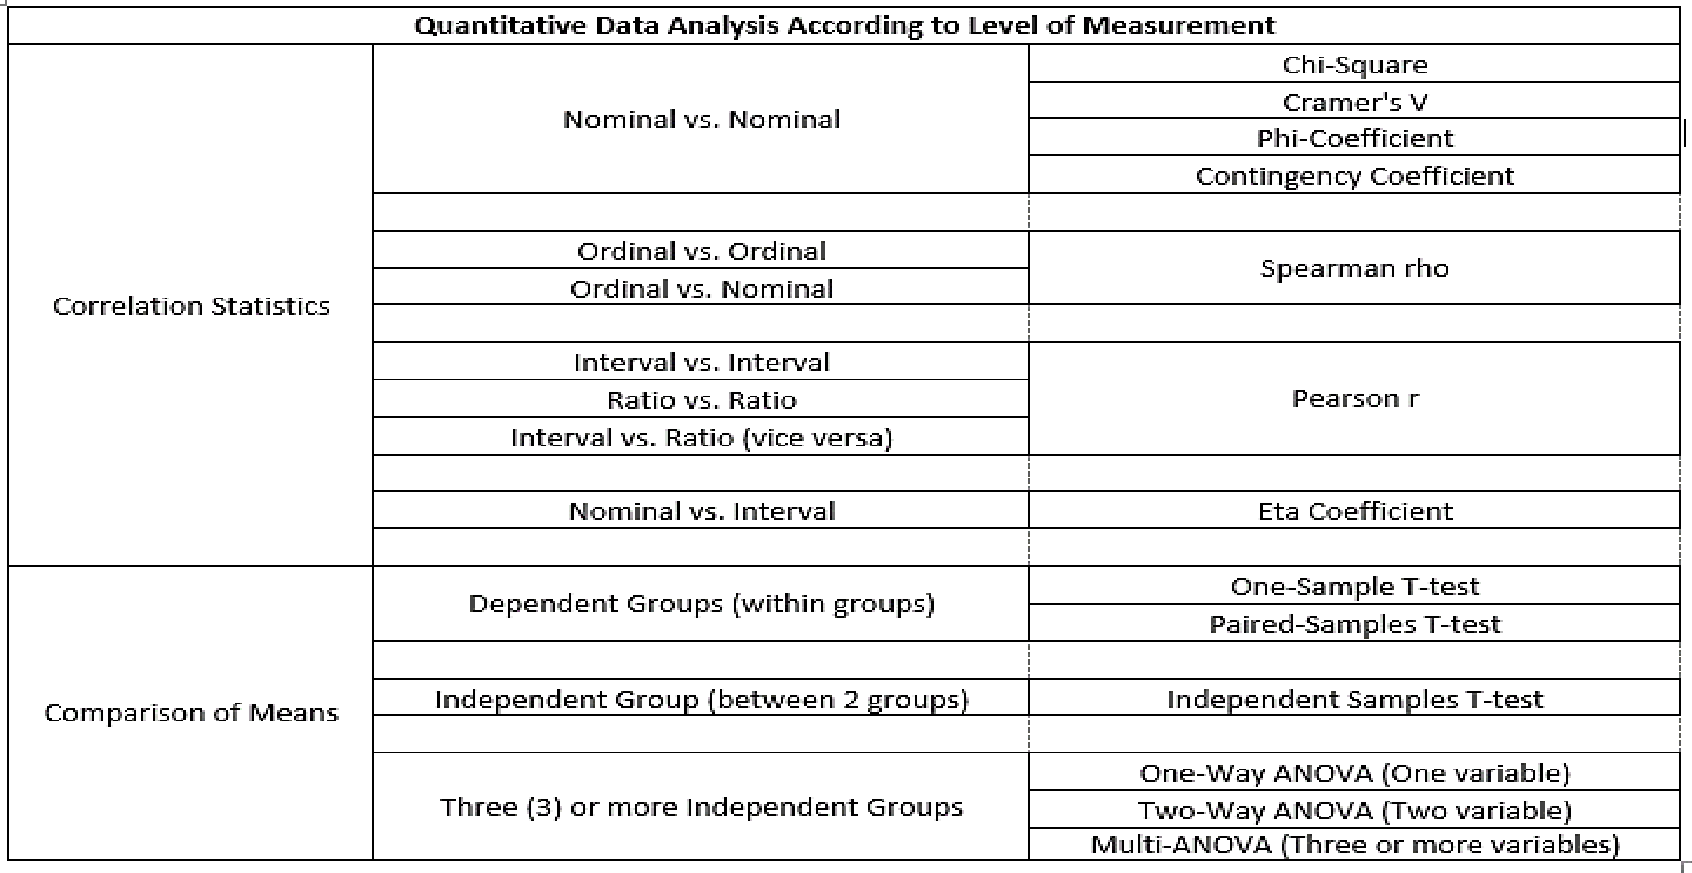
Step 3. Determine the appropriate statistical technique to be used.
Types of Statistical Tests
- Pearson r: Measures the strength and direction of the linear relationship between two interval/ratio variables.
- t-Test: Compares means of two groups.
- Paired-samples t-test: For dependent groups.
- Independent-samples t-test: For independent groups.
- z-Test: Used for large samples (>30) to compare population means.
- F-Test (ANOVA): Compares means of three or more groups.
- One-way ANOVA: For one variable.
- Two-way ANOVA: For two variables.
- Spearman rho: Measures relationships between ordinal variables.
- Chi-square test: Compares expected vs. observed frequencies.
- Median Test: Compares medians of samples.
- Two-sample Case: Counterpart of the t-test.
- Multi-sample Case: Extension for more than two samples.
- Kruskal-Wallis H-Test: Compares three or more independent groups, alternative to ANOVA.
Step 4. Identify the approach to be used in decision making as to the use of critical (tabular) value or p-value approach.
Using critical value approach in hypothesis testing:
- If the computed value is greater than the critical (tabular) value, then we reject the null hypothesis. It means that the difference/relationship is significant.
- If the computed value is lesser than or equal to the critical (tabular) value, then we fail to reject the null hypothesis. It means that the difference/relationship is not significant.
Using p-value method of hypothesis testing:
- If the p-value is less than or equal to the level of significance, then we reject the null hypothesis. It means that the difference/relationship is significant.
- If the p-value is greater than the level of significance, then we fail to reject the null hypothesis. It means that the difference/relationship is not significant.
Step 5. Conclusion
| Approach to be used | Type of Value | Symbol | Type of Value | Decision for Ho | Significance |
|---|---|---|---|---|---|
| Using critical value in hypothesis testing | Computed Value | > | Critical (tabular) Value | Reject | Significant |
| Computed Value | ≤ | Critical (tabular) Value | Fail to Reject | Not Significant | |
| Using p-value in hypothesis testing | p-value | ≤ | α | Reject | Significant |
| p-value | > | α | Fail to Reject | Not Significant |
Step 1: Record Detailed Notes
- Immediately process the information as soon as data is collected.
- Notes should include:
- Things that stood out.
- Time/date details.
- Other observations.
- Highlights from the interaction.
- Use a standardized reflection sheet template to ensure uniformity across all data collection points.
Step 2: Begin Analysis Early
- Start qualitative data analysis as soon as the first piece of information is collected.
- Review data and mentally process it for emerging themes or patterns.
- Early analysis helps you focus on patterns as they appear in subsequent data.
Step 3: Data Reduction
- Qualitative studies often produce a large volume of data, but not all of it is meaningful.
- Reduce and transform raw data to focus on what is significant.
Step 4: Identifying Meaningful Patterns and Themes
- Group data into meaningful patterns or themes for analysis.
- Two primary methods are used:
- Content Analysis: Categorizing verbal or behavioral data to classify, summarize, and tabulate information.
- Thematic Analysis: Identifying recurring themes or ideas from the data.
- The choice of method depends on the research questions and the type of data collected.
Step 5: Data Display
- Organize and compress the data into a display to facilitate conclusion drawing.
- Common formats include:
- Graphics.
- Tables or matrices.
- Textual displays.
Step 6: Conclusion Drawing and Verification
- Interpret what the findings mean and determine how they answer the research questions.
- Draw implications based on the findings.
- Verify conclusions by revisiting the data multiple times to ensure accuracy.
Categorizing data to classify, summarize, and tabulate information.
Reformulating stories presented by respondents while considering the context and individual experiences.
Analyzing naturally occurring talk or written text to interpret meaning.
A more advanced method involving:
- Familiarization.
- Identifying a thematic framework.
- Coding, charting, mapping, and interpretation.
Summarizing observations into conceptual categories and testing their coherence within the research setting. Over time, conceptual categories are refined and linked to develop a theory.
Observing the social world through photographs or films and interpreting the resulting images as a “text.”
| Hypothesis | Statistical Tool Applied |
|---|---|
| 1. The public organizations are under-using IT potentials in comparison to private sector. | t-test |
| 2. Escalation (time-delays, cost-overruns, compromise on lesser objectives) of IT projects is more common in public organizations than in private enterprises. | t-test |
| 3. IT-people overestimate while non-IT workers underestimate the role of IT in the organizations. | t-test |
| 4. Public sector is less optimistic about the role of IT than private sector. | t-test |
| 5. Professors, doctors, and consultants view IT differently. | ANOVA |
| 6. Experience of non-IT workforce is negatively correlated with perceptions about IT. | Correlation analysis |
| 7. Higher the perceptions about IT, greater are the chances/perceptions of success in IT projects. | Simple regression |
| 8. The organizational, human, contextual and technological factors collectively determine the variation in the success/failure of an IT-project. | Multiple regression |
Data analysis tools play a pivotal role in helping researchers extract meaningful insights from complex datasets. From statistical software to programming languages, these tools cater to a variety of research needs across disciplines. Understanding the strengths of these tools helps researchers select the most suitable option for their analytical tasks.
- SPSS is widely used for statistical analysis and data management especially in social sciences.
- R is a powerful and flexible open-source programming language and environment for statistical computing and graphics.
- SAS a comprehensive software suite used for advanced analytics, business intelligence, and data management.
- STATA is a statistical software package with a user-friendly interface, widely used in social sciences and economics.
- Python is a very popular language with numerous libraries and packages for data analysis, including pandas, numPy, and SciPy.
- Matlab is a software environment with powerful numerical computing and visualization capabilities.
- MS Excel’s advanced data analysis features are amazing, but people mostly used it for basic data analysis.
- SPSS Modeler is an advanced data mining and predicative analytics tool that allows for complex data analysis and modelling.
- Minitab is normally used for statistical analysis, but you can also draw excellent charts and graphs with it.
- JASP is a statistical analysis tool, offering a user-friendly interface.